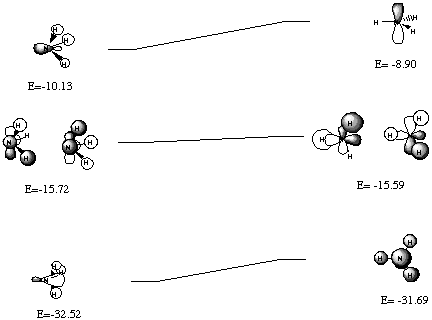
The Walsh diagram is shown below:

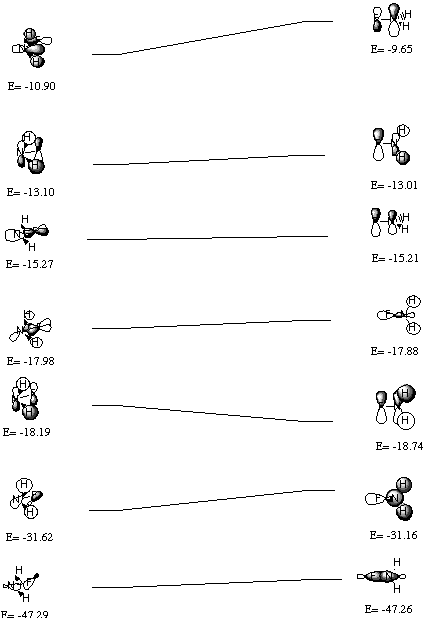
The Walsh diagram for NH2F is below:

The classical explanation for the larger inversion barrier
in the fluorosubstituted ammonia is that the more electronegative
substituent (fluorine) destabilizes the planar transition state
because it withdraws electron density more efficiently from nitrogen
(the nitrogen hybridization of the NF sigma bond is sp2
in the TS, but sp3 in the reactant). The
Walsh diagrams do not provide much support for this, as perhaps
they should not (why worry about nitrogen? Why not think of it
from fluorine's point of view and figure that is a stabilizing
interaction?) The problem appears to be one more associated with
electron correlation, and probably requires a deeper analysis
than is expected for this problem set.
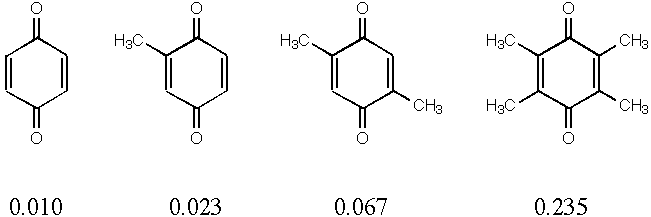
2. Quinones are used in many biological systems as one-electron
acceptors in redox processes. Below are 4 quinones with their
measured reduction potentials in eV. Reduction potential should
correlate with the energy of the lowest unoccupied molecular orbital
(LUMO)--the lower the LUMO energy, the easier it is to pump an
electron in. Calculate the LUMO energies for the 4 quinones below
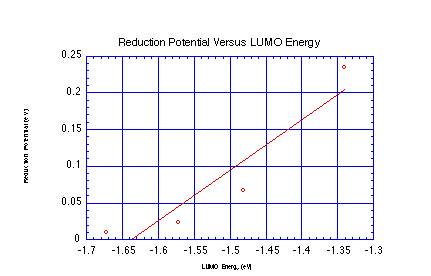
and plot against the reduction potential to get a best fit line.
Now calculate the LUMO energy for trimethylquinone and use your
fit to predict its reduction potential. How does that compare
to the measured value of 0.165 eV?

| Molecule | LUMO Energy (eV) | Red. Potential (eV) |
|---|---|---|
| Quinone | -1.67 | 0.010 |
| Methylquinone | -1.57 | 0.023 |
| Dimethylquinone | -1.48 | 0.067 |
| Tetramethylquinone | -1.34 | 0.235 |

- Linear Regression over Data Set:
- Slope: 0.688
- Intercept: 1.128
- For Trimethylquinone:
- Calculated LUMO Energy: -1.41 eV
- Predicted Reduction Potential: 0.161 eV
- Actual Reduction Potential: 0.165 eV
- Predicted Reduction Potential: 0.161 eV
This shows that the LUMO energy does a pretty good job of predicting
the reduction potential. A linear regression is warranted based
strictly on unit analysis (eV vs eV), but one could also justify
interpolation (which doesn't change the answer much). Higher order
fits are probably not warranted, although again they wouldn't
change the answer much.
3. Cubane is a fascinating molecule for a variety of reasons.
It has an isomer that can be considered to be aromatic (6 p
electrons in double bonds, 4 p electrons
in methylene bridges). What is the difference in predicted heats
of formation at the PM3 level? Is that stability what you expected?
Now, what if we replace every carbon atom with silicon, what is
the difference in stability? Is that result what you expected?
 |
vs. | 
| |
|---|---|---|---|
| Element | DHf (kcal/mol) | DHf (kcal/mol) | |
| C | 113.8 | 56.1 | |
| Si | 18.1 | 108.4 |
All-carbon cubane is very unstable, in part because carbon does not like 90o angles. Silicon, on the other hand, easily accomodates small bond angles, and persilacubane turns out to the the lowest-energy isomer of Si8H8. For a number of reasons, including long bond lengths,p overlap is poor for the persilabicyclooctatriene, while it is fine for carbon. All of these effects together account for the 150 kcal/mol (!) difference in relative energies for these two species.