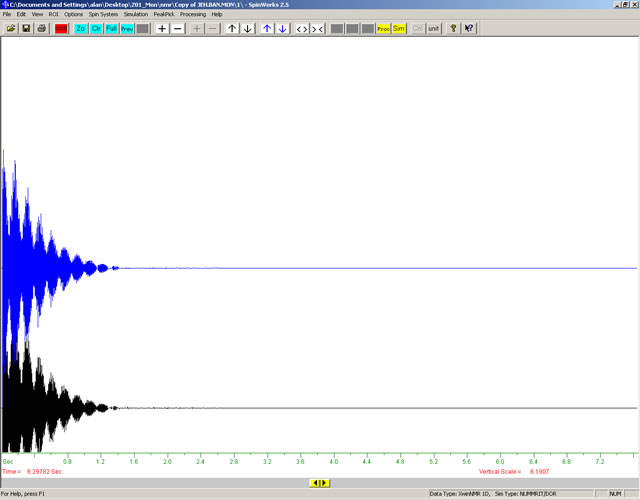
(adapted from Alan Shusterman, Reed College)
NMR data is collected using a pulse-observe procedure. The NMR instrument creates a brief pulse of radio energy. This excites the NMR active nuclei. Then the nuclei decay back to equilibrium by releasing radio energy. The released energy is called a free induction decay or FID.
To open your FID data file, do the following:
Click File: Open
Navigate to the folder that contains your NMR data
Note: Once you transform your FID to frequency data (the next step), you will never see FID data again. However, whenever you want to work on your spectrum in the future, you should still begin by opening the fid data file. SpinWorks remembers all of the processing that it has done and it will show you a complete spectrum, not the original FID.
At this point, you should see a graph that looks like this:

This graph shows the decay in signal intensity (vertical axis) versus time (horizontal axis, t = 0 on left). At this point, you can proceed to the next step.
Continue Tutorial | Table of Contents