
(adapted from Alan Shusterman, Reed College)
The time-to-frequency transformation produces complex (real + imaginary) numbers. Phasing is a process that combines the real and imaginary numbers in their proper ratio.
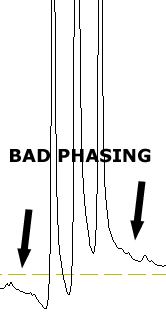
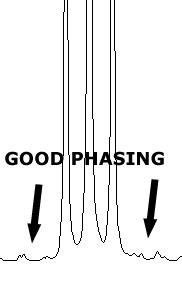
More simply, an improperly phased spectrum contains a distorted baseline around each peak, high on one side and low on the other (it may even go negative). A properly phased spectrum contains a balanced baseline. The following images show you the difference between bad phasing and good phasing.
 |
|
 |
Phasing is a three-step procedure:
It can also be done incrementally, i.e., you can make corrections over and over again. In fact, if you get frustrated, you can start over with SpinWorks' automatic procedure.
First, do the automatic procedure:
Notice that the peaks look pretty good at this point. In fact, if your vertical scale is squeezed small enough, the peaks will look great, but don't be fooled - more phasing is usually required. Now let's perform the manual procedure:
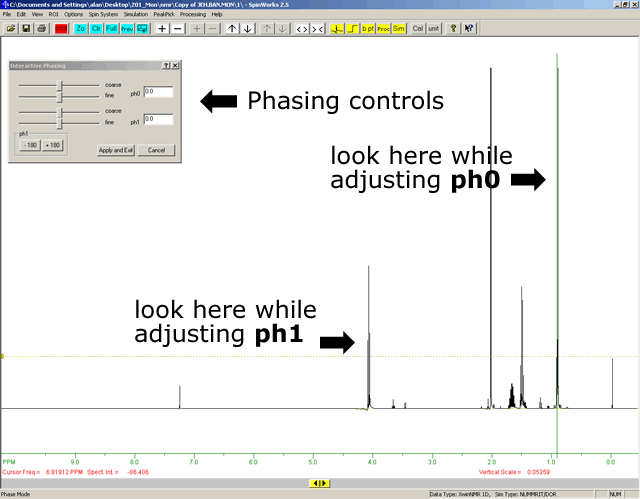
At this point, an interactive phasing window appears with four slider controls, two for ph0 and two for ph1. A green line is also drawn on the spectrum to mark the tallest peak (this is where you look while you perform the ph0 adjustments).

If your vertical and horizontal scales are squeezed too small, it will be hard to see small changes in the baseline. You should adjust these scales so that you can see the baseline around the tallest peak (and you can see small variations in the baseline).