(adapted from Alan Shusterman, Reed College)
How you process your data depends on you. For example, you can combine data in different ways before printing it. Also, you can divide your work over several sessions. SpinWorks will remember what you accomplished during the previous session (remember this because SpinWorks can quit unexpectedly).
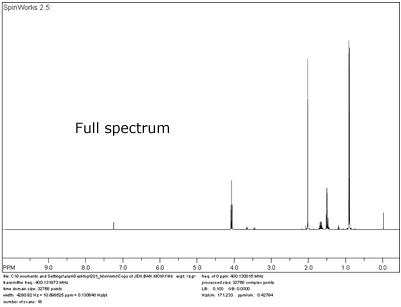
As a rule, everyone should begin by printing a "full" spectrum. This means performing the following operations:
The result of these steps produces something like the following (note the chemical shift scale runs from about -0.5 (right) to about +10 ppm (left). Click on spectrum for larger image.
Everyone should always produce a printout of the full spectrum, but it is possible to add more data to this printout. The following image shows the same spectrum supplmented with peak picks (frequency positions across the top of the spectrum), integrals (peak areas at bottom of page and inside the inset box), and an inset box (expansion of the peaks between 1.4-1.7 ppm). Click on spectrum for larger image.
Which spectrum is more useful is a subjective matter. I think this spectrum is "overloaded" because I can't use a lot of the data (the patterns are too small to assign, the peak picks are too far from the peaks to be matched up correctly). SpinWorks disclaimer: The inset box is helpful because it blows up part of the spectrum, but SpinWorks' ability to make useful inset boxes is limited. I was unable to create more than one box and I was unable to get peak picks to appear in the inset box.
This manual provides separate instructions for peak picking, integrating, and creating inset boxes, so you can jump around the manual and add the data that you want to your printout.
I recommend the following as a generally useful way to print your data:
For example, instead of the overloaded spectrum shown above, you might print out the four spectra shown below. Click on each spectrum for a larger image and additional comments.
Continue Tutorial | Table of Contents