06/30/2007
Transition
state analysis of the chemical and enzymatic prenylation reactions.
Recent Research from the group of Professor
Mark Distefano.
Protein
prenylation involves the attachment of C15 (farnesyl) or C20 (geranylgeranyl)
groups to proteins and is catalyzed by a class of enzymes known as prenyltransferases.
The observation that inhibition of Ras farnesylation arrests the growth
of tumor cells has been the motivating factor in developing inhibitors
of prenyltransferases that can serve as anticancer drugs; currently several
candidates are in Phase 3 clinical trials. We are interested in using kinetic
isotope effect (KIE) measurements to determine the transition state (TS)
structure for the enzyme catalyzed reaction since knowledge of the TS structure
may allow the selectivity and affinity of inhibitors of these enzymes to
be improved. Recently, graduates students Stepan Lenevich and Ayako Hosakawa,
and Postdoctoral Fellow Dr. Juhua Xu in the research group of Professor
Mark Distefano measured a primary 13C KIE and a secondary 2H
KIE via mass spectrometry. In collaboration with Professor Chris Cramer,
a TS structure for the farnesyltransferase enzyme-catalyzed reaction was
computed; a density functional level of electronic structure theory using
the m PW1N
functional in combination with the 6-31+G(d) basis set was employed for
those calculations. The results indicate that the enzyme effects catalysis
via an exploded TS structure with an extended C-S bond. This is the first
example of a transition state structure obtained from an enzyme catalyzed
prenylation reaction and was recently published in the Journal of the American
Chemical Society (DOI: 10.1021/ja069119j)
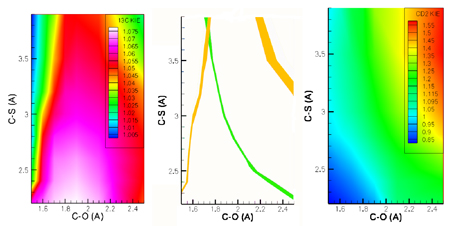
KIE
analysis of the prenylation reaction catalyzed by protein-farnesyltransferase. 3D
Contour plots of KIEs versus C-O and C-S bond lengths. Left panel: Plot
of calculated primary [1-13C] KIE (z-axis, color contours)
versus C-O (x-axis) and C-S (y-axis) bond lengths. Right panel: Plot
of calculated secondary [1-2H]2 KIE (z-axis, color
contours) versus C-O (x-axis) and C-S (y-axis) bond lengths. Center panel:
Superposition of calculated contours from Left and Right panels that
match the experimentally determined values of the [1-13C]
KIE (orange) and [1-2H]2 KIE (green). The region
of intersection gives the C-O and C-S bond lengths in the TS.
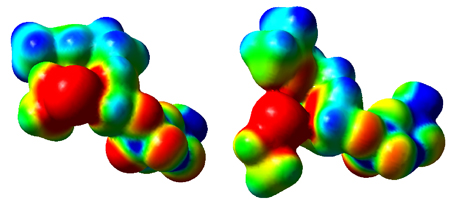
Transition
state structures for nonenzymatic reaction between GPP and ethane thiolate
and the corresponding enzyme catalyzed reaction. TS
structures were modeled in the gas phase at the m PW1N/6-31G* level of theory. Electrostatic
potentials: Left panel, nonenzymatic reaction; Right panel, enzymatic
process. Red represents more negative potential (-0.15 au), blue represents
less negative potential (-0.05 au) and green is intermediate (-0.10 au).
The electrostatic potentials are presented mapped on the 0.005 au isodensity
surface.
|